

How We Triage Production Alerts with an AI Agent in Slack
 Dott
Your production alert channel starts out useful, and then one week every second message says @channel and nobody looks up from their editor. You still need to know when production breaks, and you also do not want a second bot summarizing every false alarm into four paragraphs of polite guesswork.
We are Merlin's own team. During the five weeks covered here, two engineers ran the product with no dedicated on-call rotation and no SRE, and we pointed Merlin at our own Slack alert channel to do first-pass alert triage. Once the agent started posting replies as itself on November 6, 2026, every in-scope production alert got a short threaded reply in a median of 79 seconds: six of eight said Action needed: no, two escalated, and one became a bug fix that shipped the same day.
Getting the agent to investigate logs and code was straightforward. The hard part was teaching it restraint: when to stay completely silent on duplicates, when to call a cause unconfirmed, and how to notice when a quiet agent is actually broken.
The problem
Our staging and production environments share one small cloud host with 2 vCPUs. Monitors on the server and a PostHog log alert all post into a single Slack alert channel.
In the two weeks before we set up automated alert triage (October 8 to October 22, 2026), that channel received 39 alerts. Fourteen of them got a reply, and 25 got none at all. Every single reply happened because one of us noticed the message and asked a question in the thread. The 39 alerts broke down into a client that could not find its bundled command-line tool (9), daemon disconnect storm (7), refused webhooks (6), a PostHog alert for server error logs above 5 per hour (4), un-mentioned message dropped (3), background loop stuck (2), and one server crash.
When an alert fired at the wrong hour, it sat. On October 21 at 02:12, two background loop stuck alerts paged the channel. By the time one of us asked the agent to look, the loops had been stuck for about 7.5 hours, and production needed a manual restart.
The rest of the time, tribal knowledge stayed locked in one person's head. One daemon disconnect storm in production was dismissed by a teammate with a quick note to ignore it because the service restarted during a deploy. That was right: six of the seven disconnect storms in those two weeks carried WebSocket close code 1001, which is what our proxy reload produces during a deploy. The seventh carried close code 1000 and was a different issue entirely, with nothing written down to tell the two apart.
Then the volume jumped. In the three weeks from October 22 to November 13, 2026, the channel received 195 alerts, and 132 of them (68 percent) carried an @channel mention. Eighty-three were un-mentioned message dropped, 46 were high cpu usage, 40 were cpu usage recovered notices, and 17 were CPU jump notices from the host monitor. Because staging and production share the same host and each environment posts the same reading, a single CPU spike produces two alerts followed by two recovery notices.
Google's SRE book states the baseline rule simply: "Every page should be actionable." It also notes what happens when a channel violates that rule: "When pages occur too frequently, employees second-guess, skim, or even ignore incoming alerts, sometimes even ignoring a "real" page that's masked by the noise." In Grafana Labs' 2026 observability survey of 1,363 practitioners, "Alert fatigue remains the biggest single obstacle to faster incident response, cited by 30% of respondents, nearly double the next most common response."
Purpose-built incident tools such as PagerDuty, incident.io, Datadog, Grafana and Rootly handle grouping and deduplication as platform configuration. If your team already pays for one of those platforms, start with its built-in triage. We wanted to see how far a general coding agent pointed at a Slack channel with plain-English rules could go.
What we set up
On October 22, 2026, one of us asked Merlin directly in the alert channel: "whenever a message is posted here, triage it as an alert." Merlin created the event automation 53 seconds later and replied with what it had configured, plus two rules it had added on its own in case we wanted to adjust them.
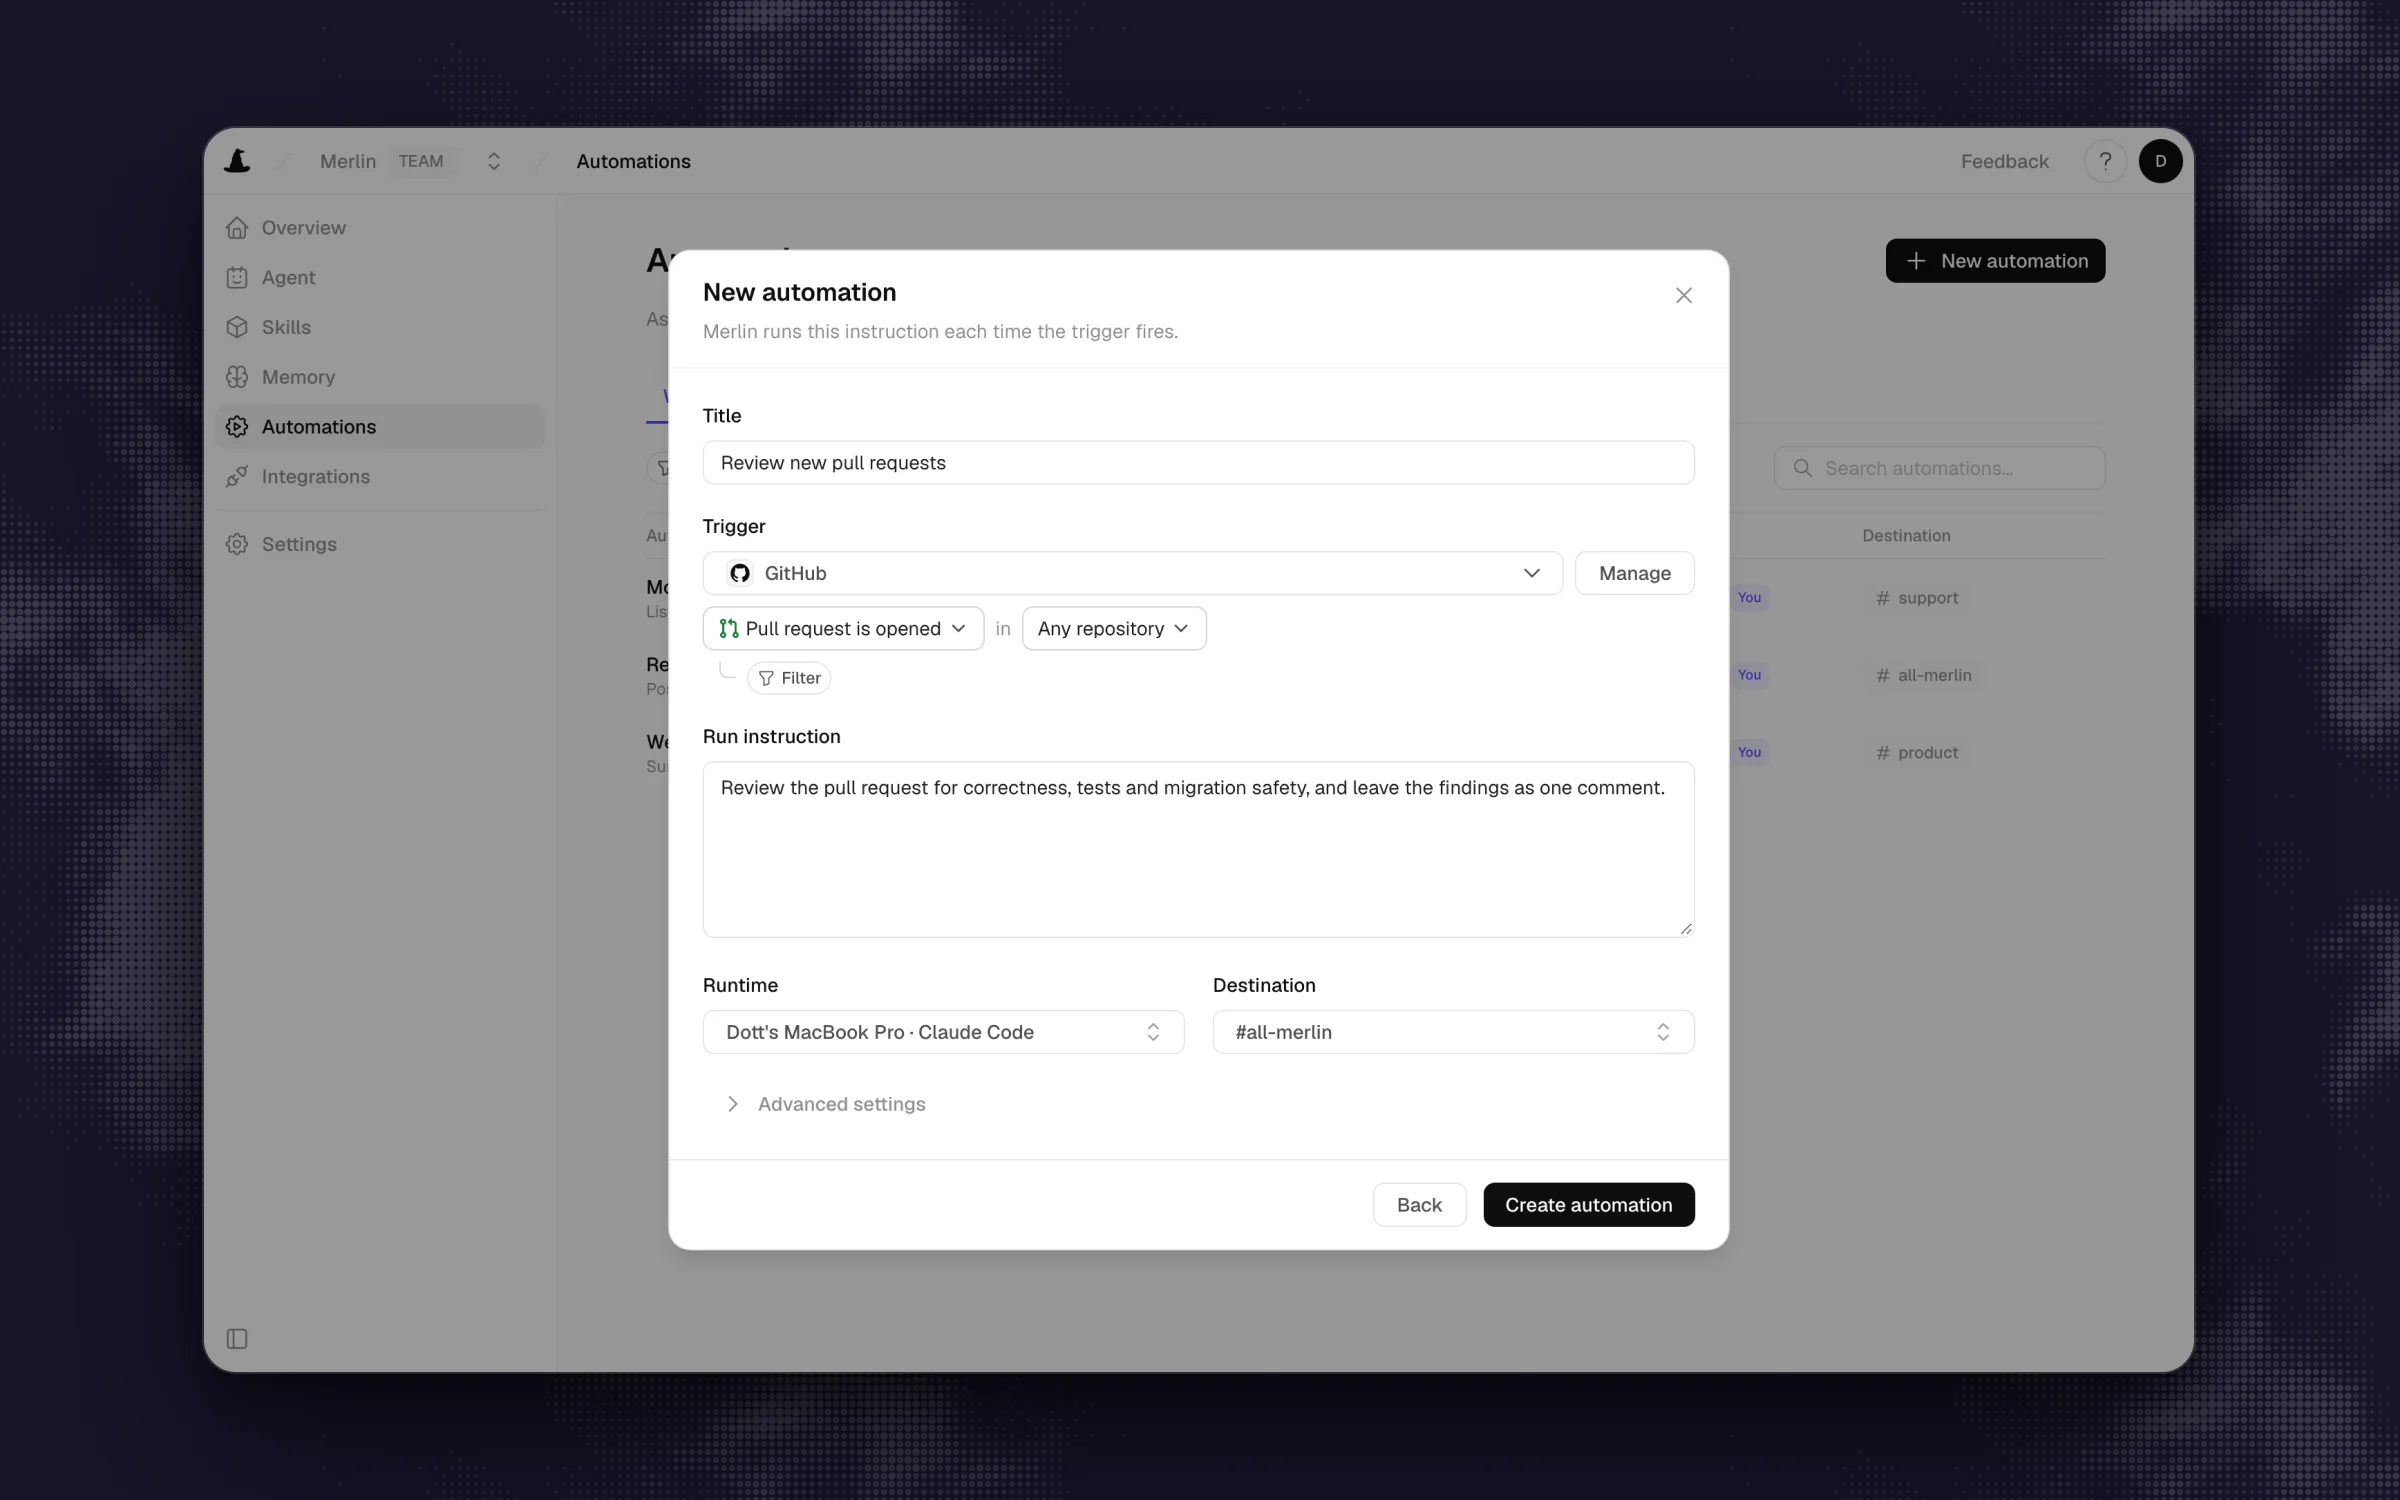 Merlin's event automation form, shown here with a GitHub trigger. The alert triage automation uses the same form with Slack as the source and a message posted in the alert channel as the event.
In Merlin, an event automation starts the moment a connected source sends a matching event, whether that is a Slack message from a person or an app, a GitHub or Linear event, or a webhook from PostHog, incident.io, Stripe, Statsig or Granola. Each automation has a creator, a trigger, a run instruction, a runtime and a destination, and every run executes on behalf of its creator. Merlin does not run overlapping runs of the same automation, so when several alerts land together, they queue up and the instruction tells the agent to handle each one.
Our automation runs on a Mac mini that stays on, driving the Claude Code installed there on that machine's existing plan. Because the agent runs on our own machine with our own credentials, it can reach the local git checkout of our repository, server logs in PostHog, our deploy channel in Slack (to line up alert timestamps against deploy timestamps), Linear for issues, and the alert channel's shared memory. What it could not always reach was the cloud provider's host metrics. When it lacked access to a data source, the instruction required it to say so.
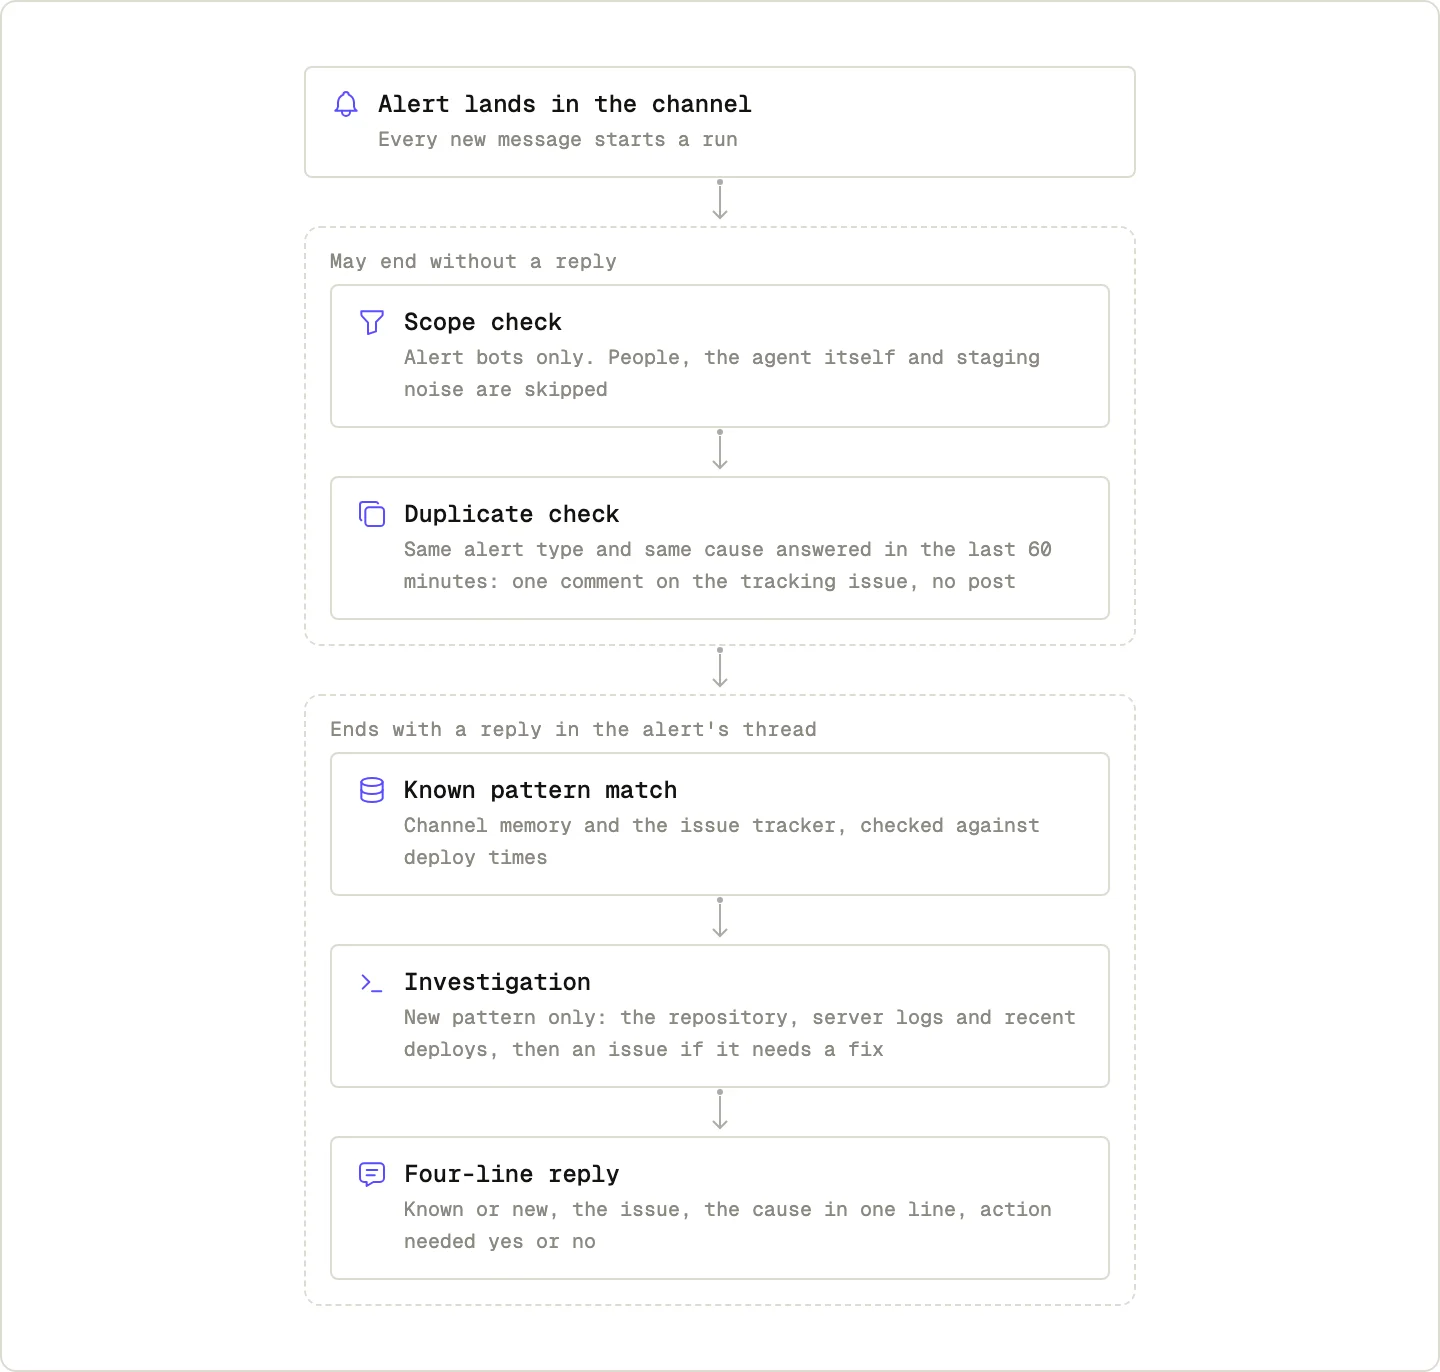 Two of the five steps exist to end the run without a reply. Investigation only happens when nothing known matches.
The instruction walks every incoming message through five steps:
- Scope check: Triage only alerts from the Merlin alert bot and the PostHog alert bot. Ignore messages from people and from Merlin itself. Ignore
stagingalerts unless they are a crash. - Deduplicate: Before replying, read the alert's thread and the last ~30 channel messages. If Merlin already replied to the same alert type with the same cause in the last 60 minutes, stay quiet in Slack and add one occurrence comment to the tracking issue in Linear.
- Match known patterns: Check channel memory and Linear against five initial known patterns, each paired with a verification check (for example, a disconnect storm with close code 1001 is a proxy reload from a deploy, confirmed by checking whether a deploy ran at that timestamp).
- Investigate new patterns: Check the repository, PostHog logs and recent deploys, and file a Linear issue if code needs to change.
- Reply in the thread: Post a short four-part reply in English with
KnownorNew, the issue link, the cause in one line, andAction needed: yes/no.
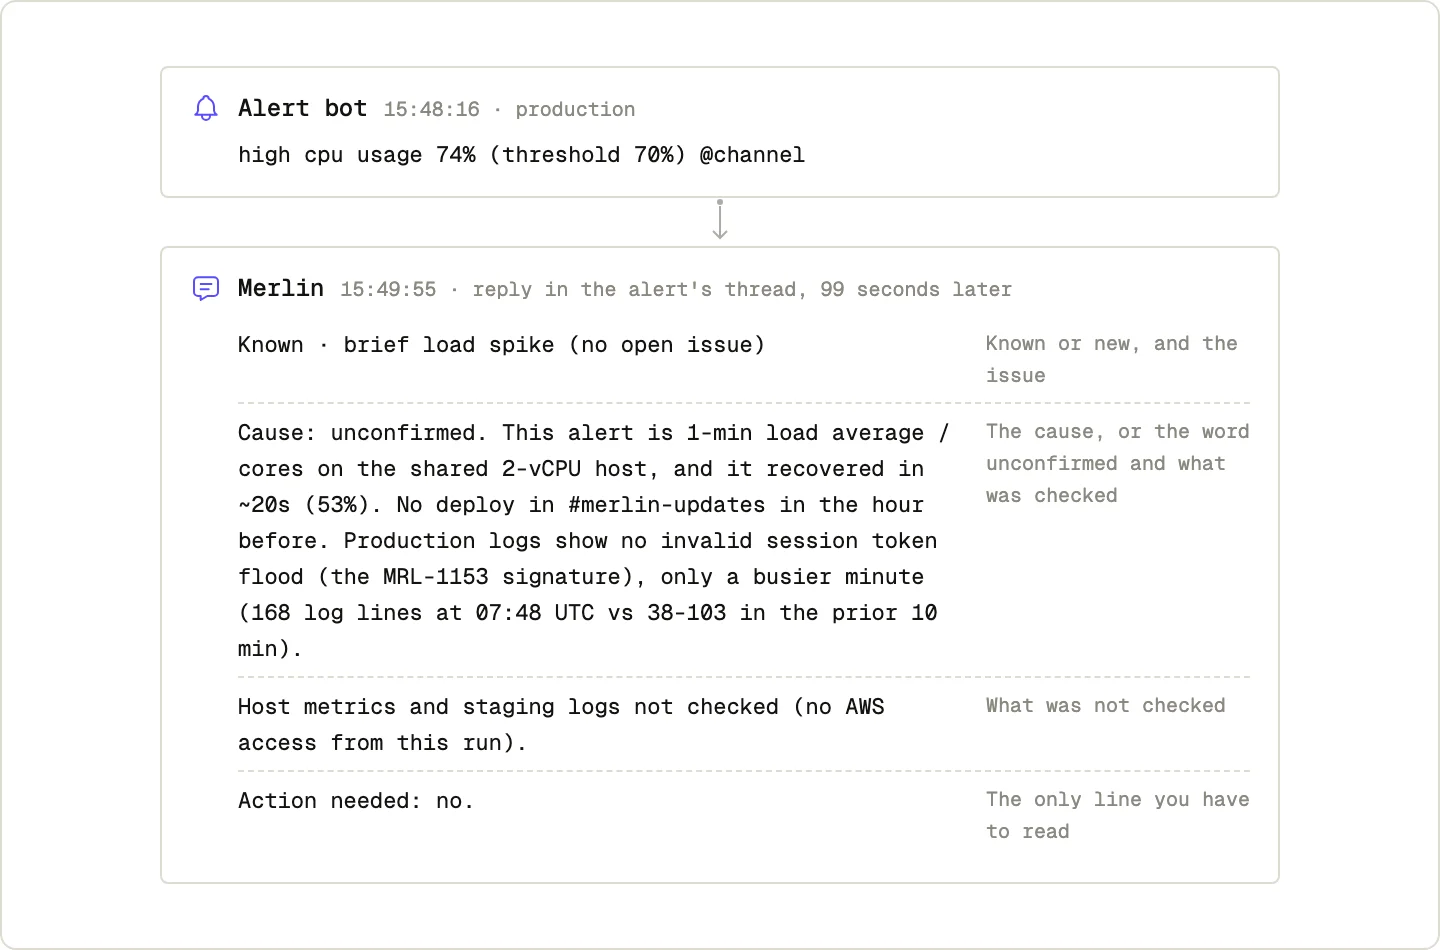 A real reply from November 6, reproduced as text with links removed. The cause is marked unconfirmed and the reply lists what the run could not reach.
The instruction ended with two strict guardrails: mention the on-call person only for a production crash, a stuck loop lasting more than 10 minutes, or a new pattern needing action, and "Never guess a cause and present it as fact. If data is unavailable, say what you checked." When Merlin created the automation, it also added two sensible defaults of its own: a disconnect storm with close codes other than 1001 does not count as the deploy pattern, and recovery notices only get a reply when the reply adds useful context such as how long the alarm lasted.
Three alerts, three outcomes
Looking at three specific threads from those weeks shows where an agent earns its keep and where it can trip you up.
A real problem: attachments that never arrived
On November 8, 2026, the PostHog alert Server error logs above 5 per hour fired with a count of 19. The automation picked it up, investigated, filed a new issue in Linear, and replied in the Slack thread 177 seconds later with a mention of the on-call person.
Its cause line read: "all 19 errors are Slack attachment download failed (truncated_body) across 10 production conversations, 13:26 to 14:12 UTC. Likely the attachment proxy rejects files whose Slack files.info size differs from the download's content-length, before any bytes arrive (unconfirmed, inferred from stage logs and attachment-proxy.ts). Up from 2 to 3 a day earlier this month." Its verdict line read: "Action needed: yes. Find why the sizes differ and stop rejecting downloadable files. Users' attachments are not reaching the agent."
In under three minutes, the agent had checked PostHog to see that all 19 errors shared a single signature, read attachment-proxy.ts in the repository to trace where truncated_body gets thrown, compared the rate against the baseline from earlier in the month, and still marked the exact mechanism as unconfirmed and inferred. We fixed the bug (accepting gzip-encoded Slack downloads) and merged the PR the same day. Out of eight alerts triaged that week, this was the only new issue the agent filed on its own.
A false alarm: ten errors in seventeen seconds
On October 26, 2026, the same PostHog error alert fired with a value of 10. One of us added the agent to the thread.
Within seconds, the agent posted an initial note: "Looking into it: 10 prod errors, all in a 17s burst at 08:54 UTC (schedule DB queries failing). Checking deploys/DB for the cause." About a minute later it came back with the full answer: "This was a one-time burst during this morning's production deploy, and it has already stopped. No action needed."
All 10 errors had occurred inside a 17-second window, and our production release had finished deploying 7 seconds after the last error. By inspecting the commits in that release, the agent saw a database migration that renamed a table. Because our deploy pipeline runs migrations before switching traffic over, the old server process spent a few seconds querying a table name that had just been renamed. The agent was also upfront about what the logs did not show: "The logs leave out the actual Postgres error, so I matched the timing and the migration instead of reading the failure directly." It verified that the error had not recurred in the previous 7 days, noted the exact impact (some progress updates from 3 running automations were lost), skipped filing an issue, and saved the deploy-rename pattern to channel memory. When a similar deploy-time host CPU jump fired on November 12, 33 seconds before the deploy success message, the agent replied in 60 seconds with a four-line note marking it as known deploy startup load with no action needed.
The one the agent got wrong: a CPU spike it called noise
On October 24, 2026, production fired high cpu usage 85% (threshold 80%), the fourth CPU spike in about 19 hours. Each spike had recovered within 20 to 40 seconds.
The agent posted its first read 44 seconds after the alert: Known. Cause: unconfirmed. It noted that staging and production reported the exact same number on the shared host and that no deploy lined up with the spike, then ended with: Action needed: no. Look into it if no recovery notice follows. When one of us asked it to dig deeper, it replied: "Nothing to fix. It recovered on its own about 40 seconds later, and both staging and production posted the recovery notice. I'd treat it as noise." It accurately explained that our monitor divides the 1-minute Linux load average by the 2 vCPUs on the host, and suggested CPU credit throttling on the burstable instance as a likely trigger while noting: "I can't get onto the server host from here" and "I couldn't see which process caused it."
The next day, one of us asked the agent to look again from a machine that had access to our cloud provider's metrics and production logs. The conclusion flipped completely: "The CPU never actually spiked. The load average did, because a client with a dead session token flooded production with WebSocket reconnects." Actual host CPU had stayed at or below 29 percent and CPU credits were full, ruling out the throttling guess. Production logs showed bursts of roughly 4,500 rejected registrations per minute, totaling 39,000 rejections in 30 minutes against a normal baseline of about 300 an hour. A client with a revoked token was retrying in a tight loop and leaking a socket on every attempt.
The fix merged on October 25, and the agent saved the signature to channel memory with a one-line verification check (which you can see running in the November 6 reply above as no invalid session token flood).
What went wrong in the first two replies was instructive. Every factual statement the agent made was true, and it explicitly stated what it could not reach. Its mistake was pairing an unconfirmed cause with Action needed: no and calling the alert noise when it lacked the one data source that could prove it. Compare that with how Datadog's investigation agent docs frame the boundary: their agent "either presents a clear, evidence-backed conclusion or marks the investigation as inconclusive when the available data is insufficient to support a defensible conclusion." The rule we took from this, written into the template below, is simple: unconfirmed and nothing to fix never belong in the same reply, and a recurring alert with an unconfirmed cause is Action needed: yes.
How the duplicate and mention rules came about
Every silence rule in our prompt answers a specific failure mode we saw in the channel history:
- Ignore staging unless it is a crash: 95 of the 195 alerts in those three weeks came from staging, and a single staging incident generated 52 alerts in about 16 hours.
- Same alert type and same cause in the last 60 minutes gets no Slack reply: Alerts arrive in bursts. Both the type and the cause belong in the duplicate key because
daemon disconnect stormwith close code 1001 is a harmless deploy reload, while the same alert name with close code 1006 is an unexpected drop. - Log duplicates as one occurrence comment on the tracking issue: Even when you silence Slack notifications, duplicates carry signal about duration, frequency and new error strings that the engineer fixing the bug will want in Linear.
- Mention the on-call person only for crashes, loops stuck over 10 minutes, or new actionable patterns: The 02:12 stuck loops that sat for about 7.5 hours are the case for putting a stuck loop on that short list. Because 68 percent of incoming alerts already cried
@channel, human mentions had to stay rare. - Silence on recovery notices: Forty of the 195 messages were
cpu usage recoverednotices, and none of them needed a thread.
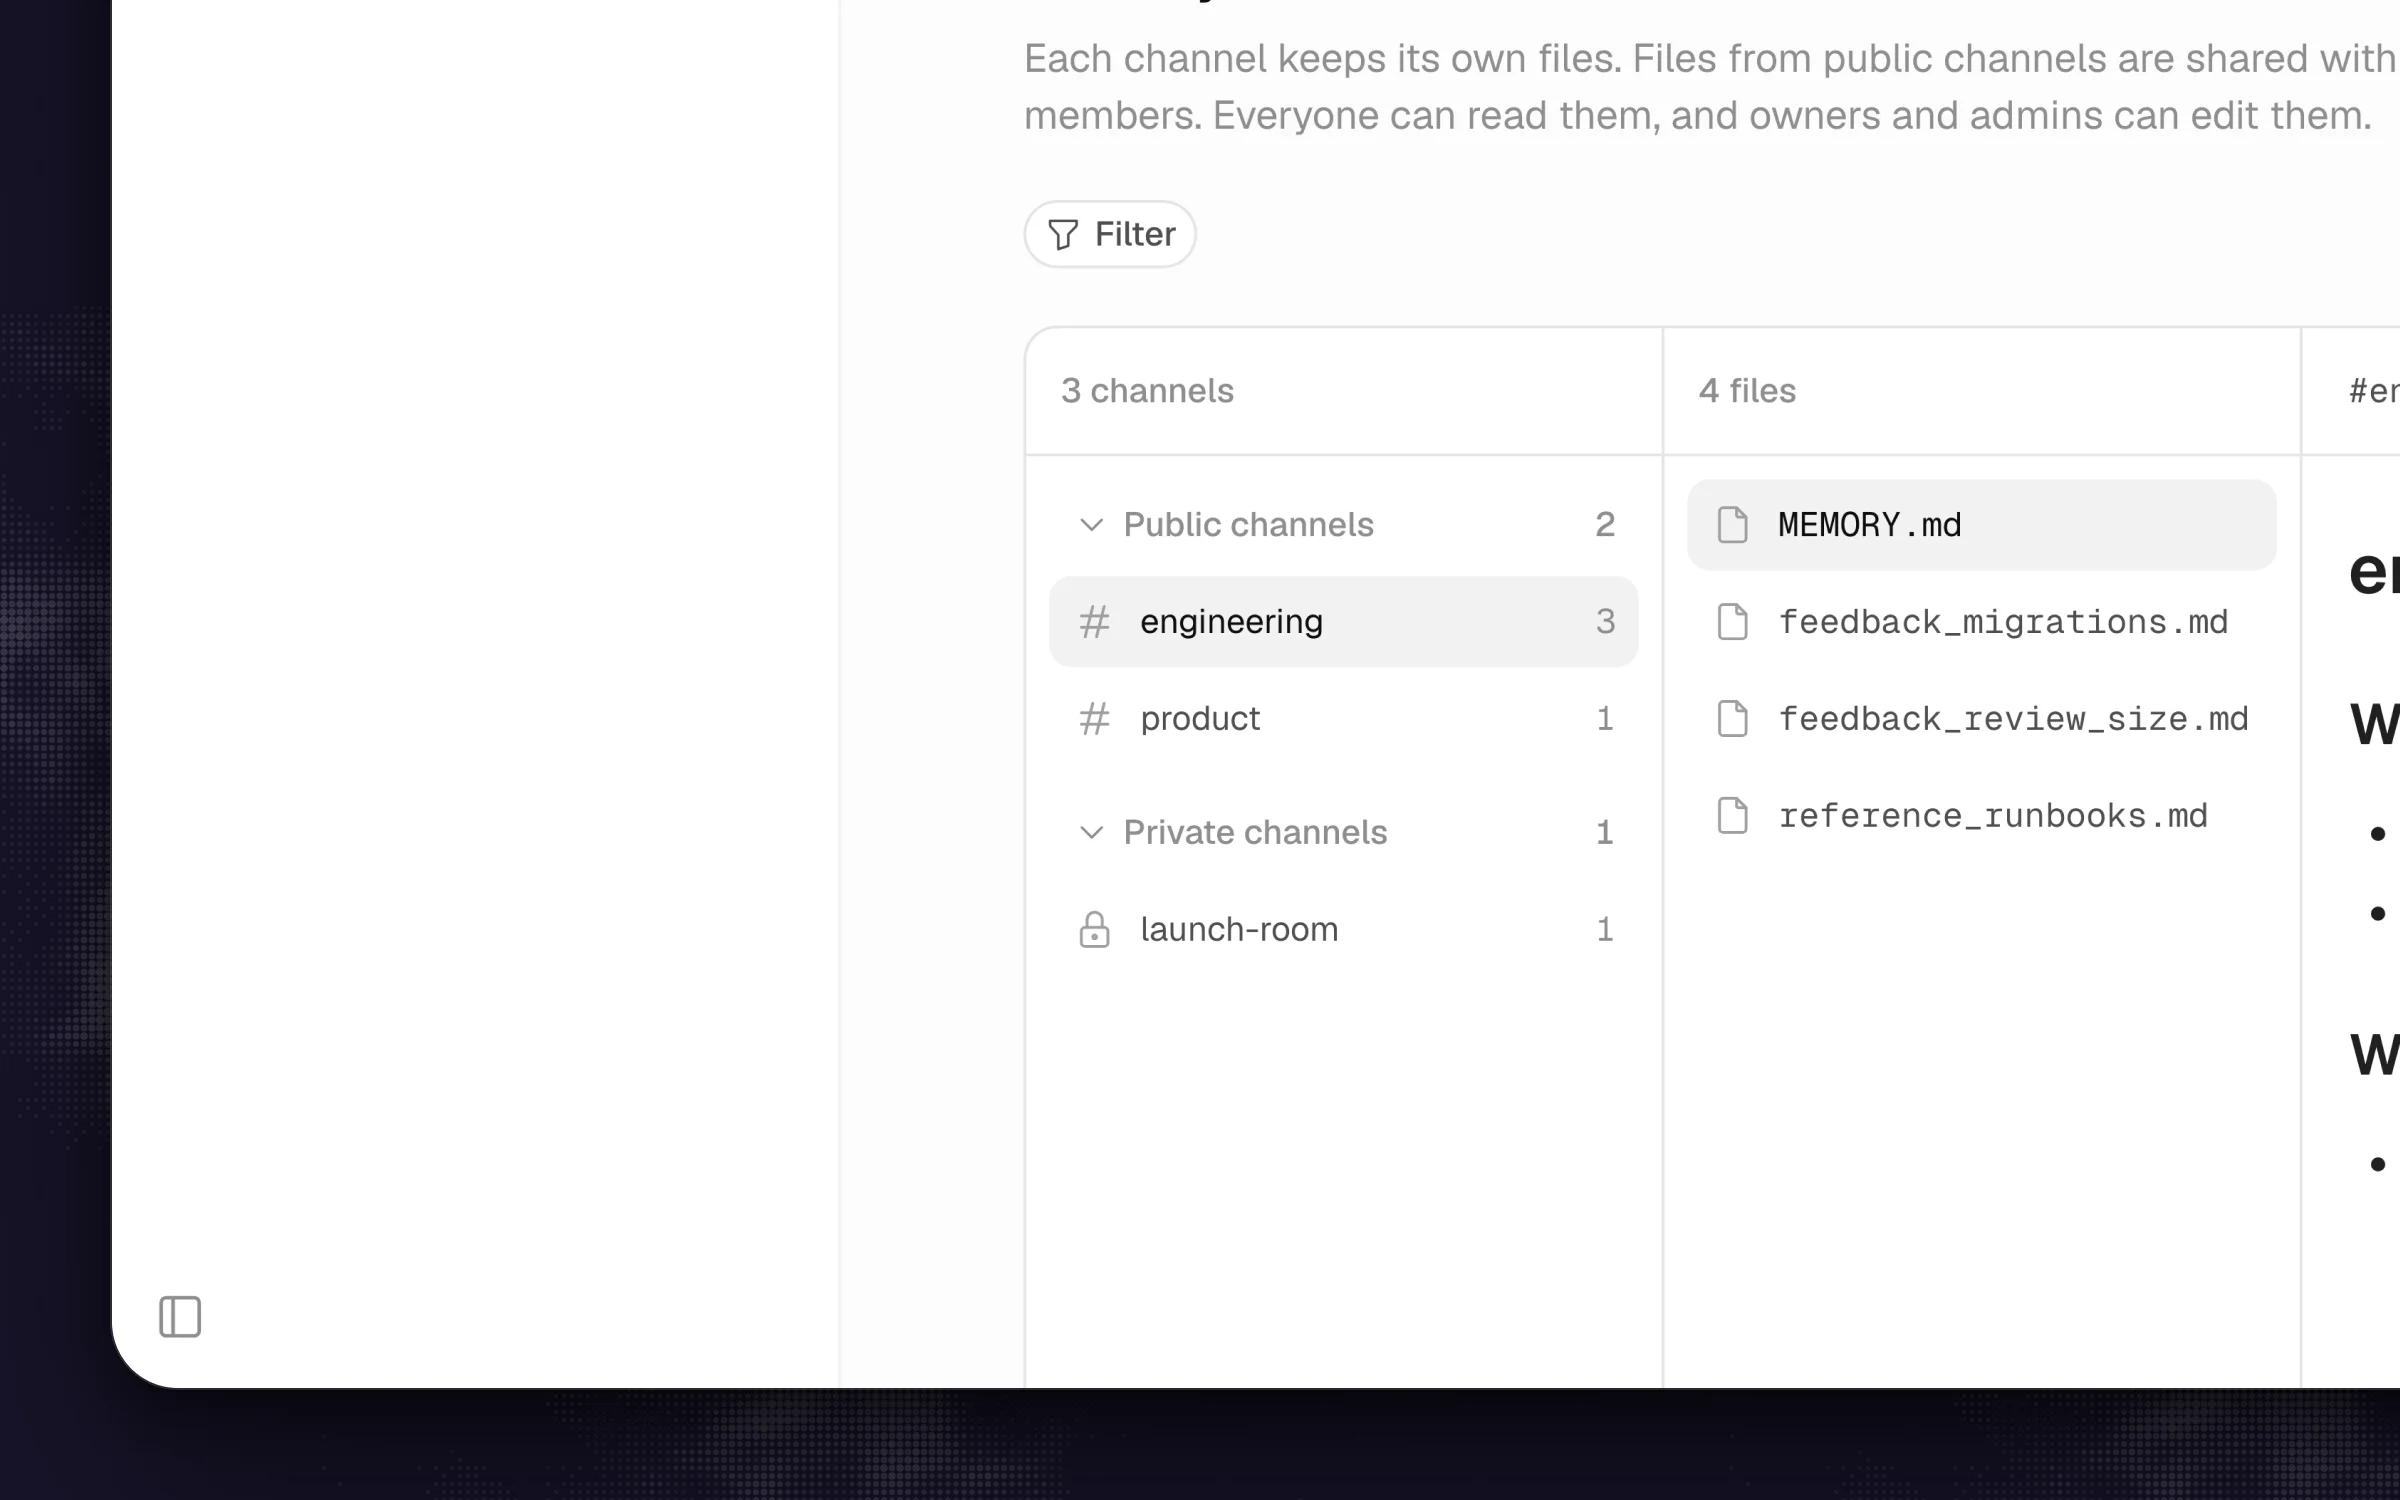 Merlin keeps memory per Slack channel as small Markdown files. Each solved alert pattern becomes one file in the alert channel's store, with the check that confirms it.
Because Merlin scopes team memory to the Slack channel where a fact was learned and stores each topic as a small Markdown file, every solved incident adds a reusable check to the alert channel's memory.
The duplicate rule got its real stress test on October 30, 2026. Production fired 24 un-mentioned message dropped alerts in 110 minutes, roughly one every 70 seconds at peak, and every single one carried @channel. The agent posted one threaded reply on the first alert 5 minutes and 34 seconds after it arrived, marked New with a link to a tracking issue: both votes of an internal classifier had started answering but failed to finish inside the 60-second limit, the reason for the stall was unconfirmed, and action was needed.
For the remaining 23 alerts, the agent said nothing in Slack. Instead, it went to the Linear tracking issue, posted three occurrence comments for the next three alerts, and then rolled the next 19 alerts into a single summary comment. That summary captured the cadence (every 70 seconds, then a pause, then one more) and noted one new detail in the duplicates: one classifier vote had returned Selected model is at capacity, which pointed at the model provider (the agent marked that link unconfirmed too). Twenty-four @channel pages became one Slack thread and four issue comments, and the most useful clue of the day was in the duplicates.
History also drives escalation when a quiet anomaly repeats. On November 8, a disconnect storm fired with close code 1006. The agent marked it New (not the deploy pattern: close codes are 1006, not 1001), listed the cause as unconfirmed, and set Action needed: no. Look into it if it happens again. Twenty-five hours later, the same 1006 storm fired a second time. Because the history had changed, the agent changed its verdict, mentioning the on-call person and writing: Action needed: yes. This is the second one in ~25h.
What changed
The table below compares the two weeks before the automation with the first week of replies as Merlin.
| Metric | Two weeks before (Oct 8 to Oct 22) | First week of replies as Merlin (Nov 6 to Nov 13) |
|---|---|---|
| Alerts in the channel | 39 | 21 |
| In scope for triage | all, in theory | 8 (the other 13: 8 recovery notices, 4 staging duplicates, 1 monitor restart) |
| Got a reply | 14 of 39, only when a person asked | 8 of 8 in scope, unprompted |
| Time to first reply | minutes to hours, one case about 7.5 hours | 54 to 177 seconds, median 79 seconds |
| Replies that asked for action | n/a | 2 of 8 |
| Issues filed without being asked | 0 | 1, fixed the same day |
| Replies to recovery notices or duplicates | n/a | 0 |
Every one of the eight automated triage threads had a single reply. The agent never replied to itself, to a human message, or to a recovery notice.
Running this setup also exposed real limits that you should weigh before building your own:
- The two quiet weeks: You will notice a gap in the table between October 22 and November 6. When we created the automation on October 22, we left the post destination empty because its job was to reply inside existing threads. A bug in Merlin caused automations without a destination to be refused Merlin's own Slack tools, so for two weeks the agent could not post as itself. On some runs it fell back to the Slack and Linear connectors on its machine, which post under the creator's own account (which is how the October 30 flood reply and Linear comments happened). On most runs, it posted nothing at all while 174 alerts went past. We failed to notice for two weeks because an agent instructed to stay silent most of the time looks identical to a broken one. We fixed the platform bug on November 4, and the first reply as Merlin landed on November 6.
- It only knows what its machine can reach: Four of the eight replies explicitly list what the run could not check (
no AWS access from this run,Merlin server logs aren't in the PostHog project I can reach). That missing access caused the bad CPU noise call. - Single-machine runtime: The automation is bound to one Mac mini. When that machine is offline or busy, the run is skipped and nothing moves it to another machine.
- Serial runs and request costs: Because runs of the same automation do not overlap, a sudden flood queues up behind itself, and a fixed 60-minute deduplication window is blunt when an incident lasts 110 minutes. In Merlin's billing plans, every automation run counts as one request against your monthly allowance (Starter includes 1,000 requests per month, Team includes 5,000, and Scale is unlimited, as listed on our pricing page on November 13, 2026). Because every message in the watched channel starts a run, a noisy channel spends requests even when the run exits early.
- Creator attribution on every message: Every automated reply starts with a header naming who the automation runs for (
Posted by Merlin for ...), which means the creator is named in every thread even when the prompt says to mention no one. - Triage is not paging: A Slack thread does not wake anyone up by phone, and it does not replace escalation policies in a dedicated incident tool. Our setup fits a two-engineer team watching one channel, and because staging is excluded by rule, a 52-alert staging flood still waited until a human asked about it.
What you can copy
If you want to hand first-pass production alert triage to an AI agent, these are the rules that held up in our channel (and if you are looking for other workflows to hand off, see our guide to engineering tasks an AI coworker can own):
- Write the silence rules before the investigation rules. Scope filters, duplicate windows and recovery rules decided 13 of the 21 messages in our channel during the November week.
- Key duplicates on alert type plus cause, and route them to the issue tracker. Give duplicate alerts somewhere useful to go in Linear or GitHub, and make the agent read them before summarizing. The upstream model capacity error on October 30 showed up inside the duplicates.
- Force a binary
Action needed: yes/noline, and pair recurring unconfirmed alerts withyes. Letting the agent writeunconfirmedprevents hallucinated root causes, and requiring action when an unconfirmed alert repeats prevents real bugs from being brushed off as noise. - Store every solved pattern with a verification check. A known pattern in channel memory needs the exact query or log check that proves it matches today's alert. Without a check, a known pattern is just a label for a guess.
- Give the agent the same read access you would give a new on-call engineer, plus a daily heartbeat. Make the agent list what it could not check in every reply, and require a once-a-day summary line so you never spend two weeks wondering whether silence means peace or a broken tool.
Below is our instruction turned into a template, with three additions these weeks taught us: one reply for a production and staging pair, the evidence rules, and the heartbeat. Copy it into your agent's automation prompt and replace the uppercase placeholders (YOUR_ALERT_CHANNEL, YOUR_ALERT_BOTS, YOUR_ISSUE_TRACKER, YOUR_LOG_TOOL, YOUR_DEPLOY_CHANNEL, ON_CALL_PERSON) with your own tools and pattern checks:
Whenever a message is posted in YOUR_ALERT_CHANNEL, triage it as an alert.

Scope
- Only messages from YOUR_ALERT_BOTS. Ignore people and ignore yourself.
- Ignore staging alerts unless they are a crash.
- Recovery notices get no reply unless you can add something, such as how long the alarm lasted.
- Several alerts may arrive in one run. Handle each one.

1. Deduplicate first
- Read the alert's thread and the last 30 channel messages.
- If you already replied to the same alert type with the same cause in the last 60 minutes, do not reply. Add one occurrence comment to the tracking issue instead: time, environment, and anything that differs from the first occurrence.
- If the same alert fires in production and staging within a minute, reply once on the production alert.

2. Match known patterns
- Read this channel's memory and search YOUR_ISSUE_TRACKER.
- A pattern only matches when its check passes. Known patterns:
  - ALERT_NAME with SIGNATURE = CAUSE, tracked in ISSUE. Check: HOW_TO_CONFIRM.
  - Add one line per pattern.

3. Investigate anything new
- Use the repository, the logs in YOUR_LOG_TOOL and recent deploys in YOUR_DEPLOY_CHANNEL.
- Look for: what changed, when it started, how often it happened before, who is affected.
- If it needs a fix, file an issue with the evidence and link it.
- When you solve a new pattern, save it to this channel's memory with the check that confirms it.

4. Reply in the alert's thread, four lines at most
- Known or New, and the issue link.
- Cause: one line. If you could not confirm it, write "unconfirmed" and what you checked.
- Not checked: anything you could not reach.
- Action needed: yes or no, and the next step if yes.

5. Mentions
- Mention ON_CALL_PERSON only for: a production crash, a problem that has lasted more than 10 minutes, or a new pattern that needs action.
- Otherwise mention no one.

6. Evidence
- Never present a guessed cause as fact.
- Unconfirmed plus recurring (three or more times in 24 hours) is "Action needed: yes".
- "Nothing to fix" requires a confirmed cause.

7. Heartbeat
- Once a day, post one line in YOUR_ALERT_CHANNEL: alerts seen, skipped as duplicates, answered, escalated.
If your team already runs PagerDuty, incident.io, Datadog or Grafana, turn on their native grouping and investigation features first. If you are a small engineering team living out of a noisy Slack channel with Claude Code or Codex already on your machines, paste the template above into a channel automation and let the agent take the first look.
Try Merlin for free
Hand work to Claude Code and Codex from Slack, Linear and GitHub. Free for 14 days, no API keys, no card required.
Get started for free